62% of AI Users Apply It to Just 1–2 Tasks: What the Epoch AI / Ipsos Data Shows
In November 2025, Stanford data surfaced an unexpected fact: Americans were using AI more at home than at work. We unpacked that in a mysummit.school piece here – and the takeaway then was blunt: work AI was still catching up to personal AI.
Four months later, Epoch AI teamed up with Ipsos for new research – and the picture has shifted.
50% of working AI users now apply it at work at least as much as at home. Of those, 25.73% use it primarily for work tasks, and another 25.31% roughly evenly. The transition happened. AI has moved from the kitchen to the office.
But this is exactly where it gets interesting. Because “I use it at work” and “I use it seriously” are two very different things.
About the research
In March 2026, Epoch AI published “AI is a common workplace tool” – an analysis based on Ipsos KnowledgePanel data. That’s a probability-based panel that recruits participants via random address sampling, not online self-selection. In practice, it means more representative data on the US adult population than a standard online poll.
Sample size: more than 2,000 American adults. Collection date: March 2026. The raw survey data is published separately.
What makes this research valuable is that it doesn’t ask “are you aware of AI.” It asks about specific behavior – how often, for what tasks, in what mode, with what intensity. It’s an operational snapshot, not an awareness one.
A crack in the AI-revolution story
Let’s start with the uncomfortable number. Nearly 49.2% of American adults don’t use AI at all. This isn’t “rarely use it” – it’s complete absence of any interaction with any AI tool.
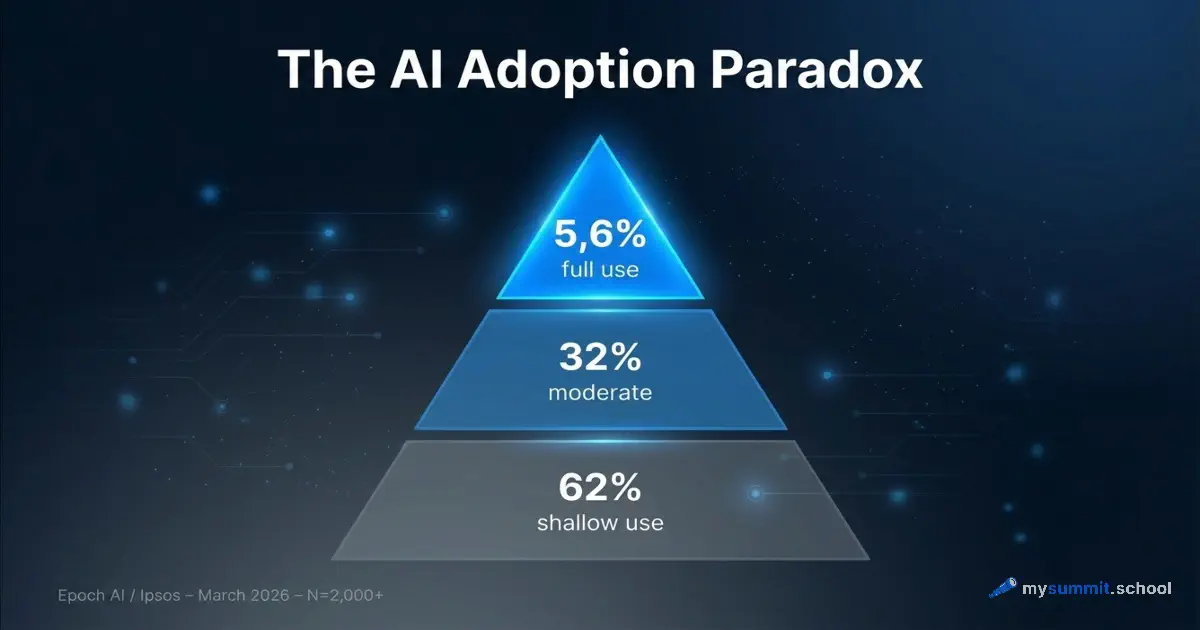
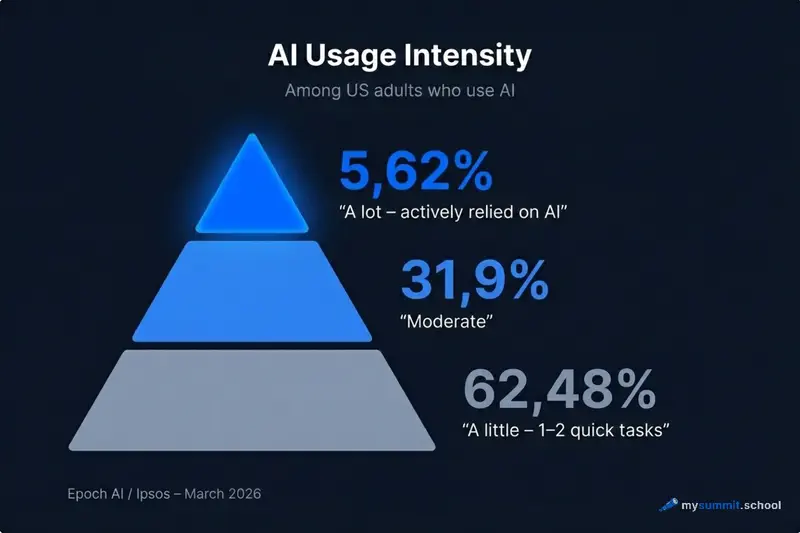
Of those who do use it, the intensity picture looks like this:
| Intensity | Share of users |
|---|---|
| “A little” – 1–2 quick tasks | 62.48% |
| “A moderate amount” | 31.9% |
| “A lot” – relied heavily on AI | 5.62% |
More than six out of ten AI users apply it superficially. One or two queries, and that’s enough. This isn’t adoption. It’s an acquaintance that never grew into anything more.
Frequency tells a similar story. 34.91% of users turn to AI once a week. 48.4% use it two to five days a week. Daily (six to seven days) – only 16.69%.
Now look at what’s happening with task displacement. Only 19.07% of users report that AI has replaced any of their existing tasks. And only 14.4% say AI has enabled them to do tasks that weren’t accessible before.
Which means: for most people, AI hasn’t restructured work. It’s just been added alongside – like another browser tab.
We’ve seen this picture before. In the Brookings survey, the same 57% of users delivered only 19% of tangible returns. Now we have the detailed explanation: the problem isn’t the tools, it’s the depth of application.
What the 95% are actually doing
The task data shows what the typical AI user is really occupied with.
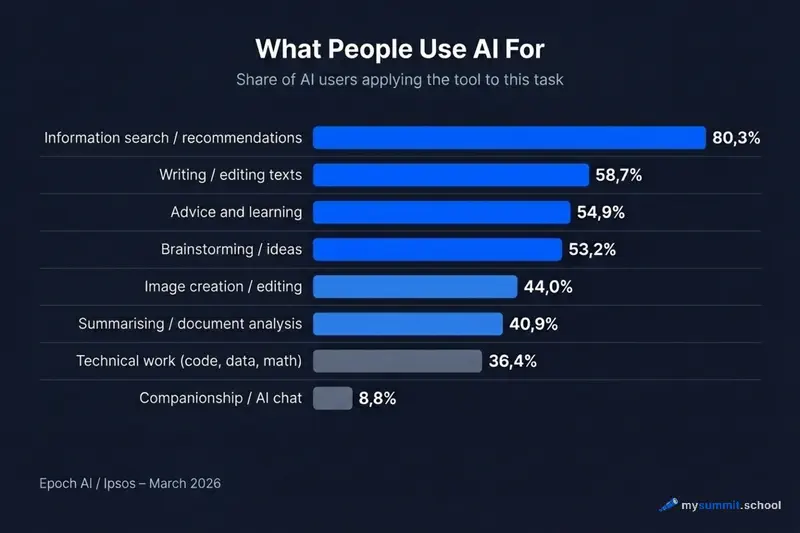
Task #1 – looking up information and recommendations: 80.29%.
Eight out of ten users treat AI as enhanced search. ChatGPT or Gemini as a Google replacement – with a slightly more coherent answer. It’s the lowest barrier to entry and, accordingly, the lowest value for work.
Next up: writing and editing text (58.66%), advice and learning (54.89%), brainstorming (53.23%). These are useful applications, but they describe one-off assistive operations, not systematic embedding of AI into a workflow.
Summarizing and analyzing documents – already only 40.88%. Technical work (math, code, data) – 36.38%. And autonomous agents – just 8.6%.
The interaction-mode data is even more telling:
- Typed a question manually: 75.62%
- Uploaded a file, image or document: 40.93%
- Asked AI to search the web: 48.45%
- Used AI inside another app: 27.54%
- Used an autonomous agent: 8.6%
Three-quarters of users work in “typed – got an answer” mode. That’s chat. It’s the simplest and least integrated way of working with AI.
Uploading your own documents – already fewer than half. Agentic mode, where the AI executes a sequence of actions on its own – fewer than one in ten. That’s where the real productivity lives, but that’s where only a small minority ever arrives.
The tools are the same for everyone. The open module walks through 9 real work tasks where the gap between superficial and systematic use becomes visible. Free, no registration.
No payment required • Get notified on launch
The profile of the 5.6% who use AI “a lot”
The survey data lets us look at heavy users across demographic groups.
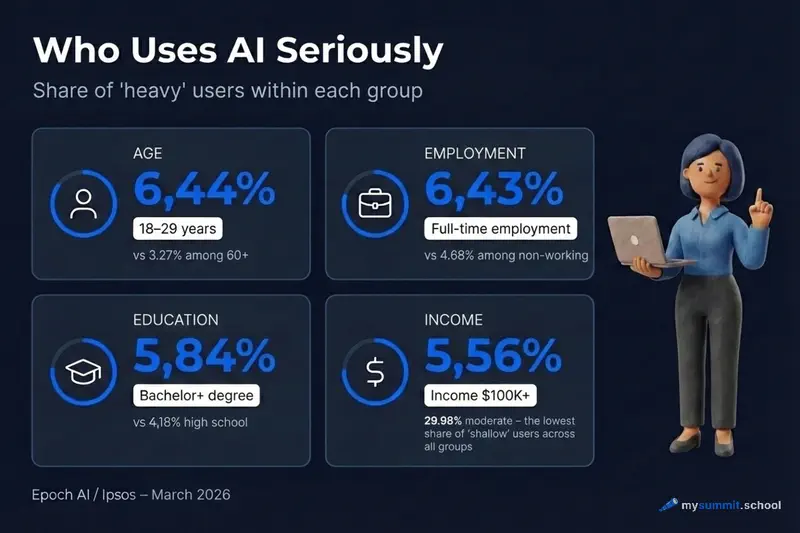
Age. 18–29-year-olds: 6.44% are heavy users. Over 60: 3.27%. There’s a gap, but it’s smaller than you’d expect. This isn’t a “young vs. old” story.
Employment. Full-time workers: 6.43% heavy users versus 4.68% among the non-working. Full-time employment correlates with deeper AI use, which tracks: more work tasks mean more reasons to apply the tool seriously.
Education. Bachelor’s degree or higher: 5.84% heavy users. High school diploma: 4.18%. Education matters, but not dramatically.
Income. $100,000+: 5.56% heavy users, and 29.98% moderate users. The high-income group doesn’t stand out by being heavy users more often – they stand out by being significantly less likely to stay at the most superficial level.
The most significant variable is a paid ChatGPT subscription. Paid subscribers make up only 7.39% of the whole sample, but they’re disproportionately represented in the heavy-user category. No surprise there: when someone pays for a tool every month, they’re motivated to use it more deeply.
What unites the heavy users? Not age, not profession. They’re people who started using AI for real tasks, rather than experimenting with a single query. They developed habits, not reflexes.
How to tell if you’re in the 62%
A few signals that point to superficial AI use:
1. Every new conversation starts from scratch. You open a new chat instead of continuing the previous one. The AI knows nothing about your project context, your team, your preferences.
2. You phrase your request in a single sentence. No task context, no constraints, no criteria for a good answer. You get a generic response – and you’re fine with that.
3. You’ve never uploaded your own documents. Reports, data, correspondence stay outside the AI. You work with abstract examples, not your own materials.
4. Your AI is for drafts you end up rewriting entirely anyway. The output is so generic it’s faster to write it yourself. That’s a signal of a weakly framed task, not a bad tool.
5. You use one tool for everything. ChatGPT for search, for text, for data analysis, for code. Meanwhile, each of these has specialized alternatives that deliver better results on specific tasks.
6. You don’t know how much time AI saved you last week. A measurable result is a sign of systematic use. If there’s nothing to measure, chances are the use stayed superficial.
Three habits that separate the systematic user from the casual one
The gap between 5.6% and 62% isn’t about access to tools. Everyone uses the same ChatGPT, Gemini or Copilot. The difference is in how they work with them.
Habit 1: the whole task, not a phrase.
The superficial user asks “write an email to the client.” The systematic user describes: who the recipient is, what the relationship history is, what the desired outcome of the email is, what tone fits, what can’t be agreed to. The difference in output quality is multiplicative.
The same principle works for analysis. The Workday research showed that a significant share of the “time saved by AI” goes to fixing errors. The cause isn’t the models – it’s incomplete task framing.
Habit 2: upload your own, don’t work with abstractions.
Uploading a file, a document, a spreadsheet – that’s what only 40.93% of users do. Yet it’s with your own materials that AI delivers non-generic, specific results. Ask AI to analyze your actual quarterly report and you get conclusions you can act on.
Habit 3: explicitly state quality criteria.
What does a “good answer” mean for your task? Length? Tone? Structure? Specific points that need to be present? Most users never articulate this – and they get the first plausible answer, not the best possible one.
The systematic user says: “The response should be no longer than three paragraphs, aimed at a non-technical audience, and must not include budget recommendations.” It’s not hard. It’s just the habit of being precise.
These habits look simple on paper. The difficulty starts when you need not an approximately similar result, but a precise one – reproducible from task to task. The difference between “it worked once” and “it works reliably” is a task-framing skill for AI, and it’s built not on abstract examples but on real work situations.
Try AI on 9 real manager tasks – the exact ones where most people stay on the surface. Open module, free, no registration.
No payment required • Get notified on launch
Context: what’s changed in four months
The Epoch AI / Ipsos data is interesting to read alongside what we’ve covered before.
Stanford SWAA (November 2025) recorded that personal AI use was outpacing work use. People were learning on themselves. March 2026 shows that some of that learning has crossed over to work – 50% of working users now apply AI at work at least as much as at home.
Gallup (May 2025) showed a gradual climb: 45% at least once a year, 23% weekly. Epoch AI / Ipsos confirm that picture from another angle: among those who do use AI, frequency is already reasonable – almost half use it two to five days a week. The problem isn’t frequency. It’s depth.
That’s an important distinction. When we say AI “hasn’t been adopted” at a company or by a specific professional, we usually mean exactly this: superficiality, not absence. The tool is there, the habit of opening it is there, but the tasks handed over to it are still cautious and partial.
Oddly enough, it’s precisely now, when work AI has caught up with personal AI in frequency, that the next problem has come into focus – depth of use. The “home -> work” transition has happened. The “superficial -> systematic” transition is still ahead for most.
What’s next
This is the first of two articles. The Epoch AI / Ipsos data contains another important storyline – about how AI tool market share is distributed in the workplace: what employers pay for, what employees grab on their own, and why Microsoft Copilot holds a counter-intuitively high position in the corporate segment.
In the next piece we’ll unpack why Microsoft quietly won work AI while everyone was watching ChatGPT – and what that means for leaders picking a tool for their team.
From superficial to systematic
The foundational module of the course walks through exactly this transition: from 1–2 queries to AI – to reproducible results on real work tasks. Foundation + specialization for managers.
Stanislav Belyaev
Engineering Leader at Microsoft18 years leading engineering teams. Founder of mysummit.school. 700+ graduates at Yandex Practicum and Stratoplan.