AI at work: adoption keeps rising, the returns stay flat
AI models in this article
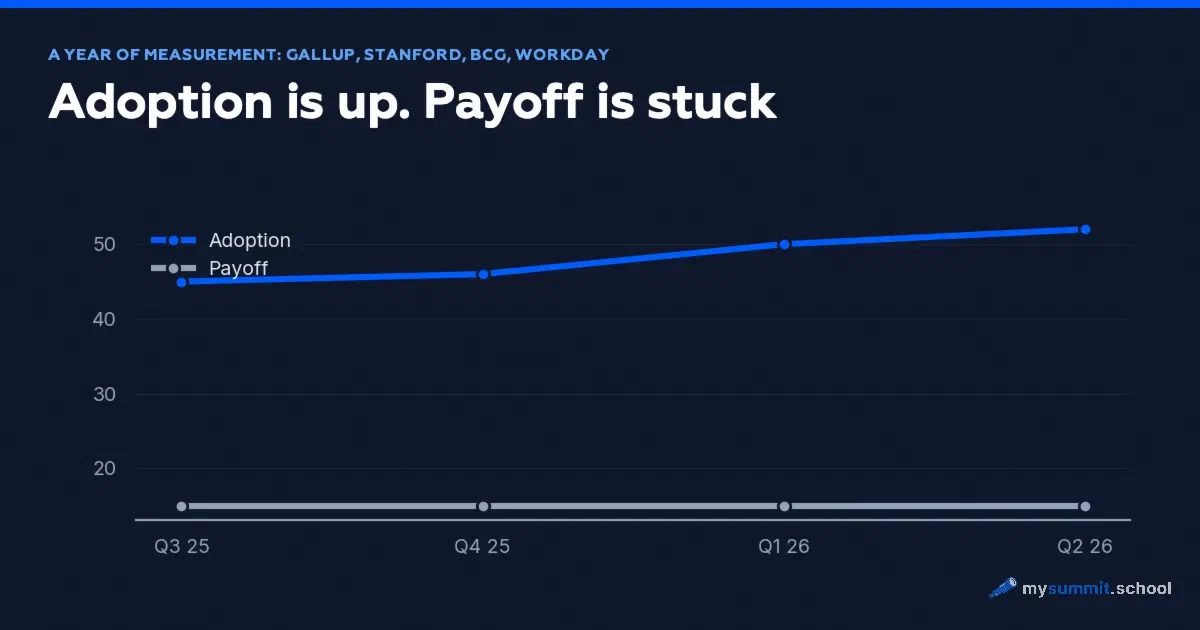
Over the past year this blog has worked through more than a dozen large studies of AI at work: Gallup, Stanford, Wharton, BCG, Workday, Epoch AI, Google, Microsoft. Each report tells its own story, and we tested each story on its own terms. Stitched into one timeline, they show something no single report contains: two curves that have spent the year heading in different directions.
The first is adoption. It climbs in a straight line, and predictably: Gallup’s quarterly measurements put daily AI users among working Americans at 15%, up from 8% a year earlier, while Stanford’s AI Index has corporate adoption at 88%. The second curve is return, and it is flat. Workday estimates that 14% of employees get a net gain from AI once the rework is subtracted, and in a year of watching, that number has not moved.
Below are both curves, built from the primary sources we tracked all year, with notes on what can and cannot be compared. Behind them sit four cuts that appear only in the aggregate: the mix of tasks, trust and error, the effect on business, and geography.
How we counted
Rules first. Without them this piece would be manipulation.
The surveys here cannot be compared directly. Gallup polls working adults in the US. Stanford’s SWAA measures days per week. The AI Index collects corporate reporting. Workday, BCG and Wharton run their own panels in other countries, with different question wording. You cannot add their percentages into one average, and I do not. What can be done honestly is to watch where each series moves on its own, then check whether the directions disagree.
One source does have comparable waves: the quarterly Gallup Panel series, one instrument, one methodology, samples above 22,000 people per wave. So the backbone of the first curve is Gallup, and the rest work as independent confirmations. Almost every figure below links to our own breakdown, with the methodology and the caveats in it.
The adoption curve: boring, linear growth
Here is the Gallup series in full, from 2023. “Frequent” means several times a week or more:
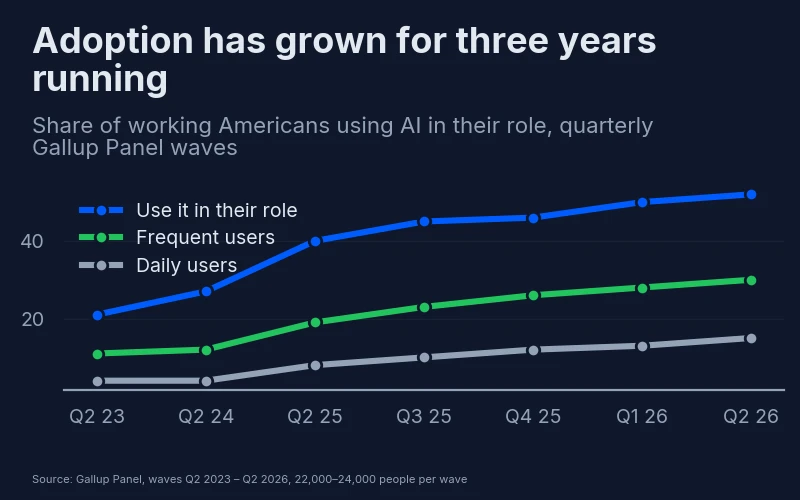
Over the year the share using AI rose 12 percentage points, and daily users almost doubled. No explosion – two or three points a quarter, wave after wave. We recorded the series twice: the December breakdown carried the third quarter of 2025, the August one the second quarter of 2026.
Other sources measure different things in different ways, and point the same way. Stanford’s SWAA, a monthly survey with more than 200,000 observations, clocked work use rising from 0.4 days a week in December 2024 to 0.5 days in October 2025. The AI Index recorded corporate adoption climbing from 78% to 88% over the year. At BCG the share of rank-and-file employees calling themselves regular AI users grew 23 percentage points in a year, to 74%. Wharton in October 2025 counted 82% of executives working with AI every week.
The caveat again: these five series measure different phenomena, and their exact levels cannot be compared. What is telling is something else – none of them showed a plateau or a reversal. The question of whether to adopt AI is closed at the level of statistics. The market answered.
The return curve: flat
Now the second timeline, the measurements of what people and companies get back.
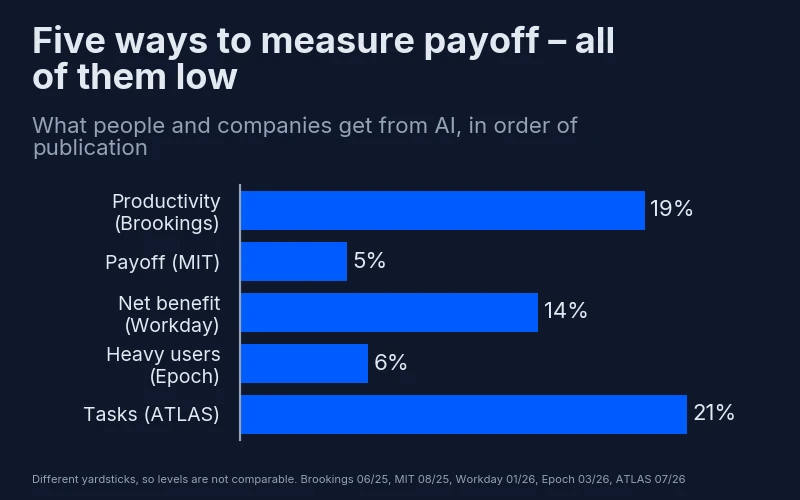
The first signal came in June 2025: Brookings polled 1,163 Americans and found that while 57% use AI, only 19% see a productivity gain. In August 2025 MIT NANDA published an analysis of more than three hundred deployments against $30–40 billion of corporate investment: 5% of organisations got a measurable return (in Russian), and the other 95% saw no effect on their financial results.
Then the confirmations arrived from several directions at once. Workday, with a sample of 3,200, found that 87% of employees use AI and 77% believe themselves more productive – but only 14% get a net gain once the time spent fixing output is deducted. Nearly 40% of the time saved goes on correcting the AI’s own mistakes (37% in the report’s exact wording). Epoch AI and Ipsos in March 2026 showed that 62% of users apply AI to one or two tasks. Google’s ATLAS team went through 14.65 million real Gemini conversations: AI is present in occupations employing 88% of US workers, but the median occupation applies it to 21% of its tasks (in Russian).
And an eight-month observation of roughly 200 employees at a technology company, published in HBR, added the mechanism: saved time is not released, it comes back as a larger workload, fewer pauses and work smeared across the evening.
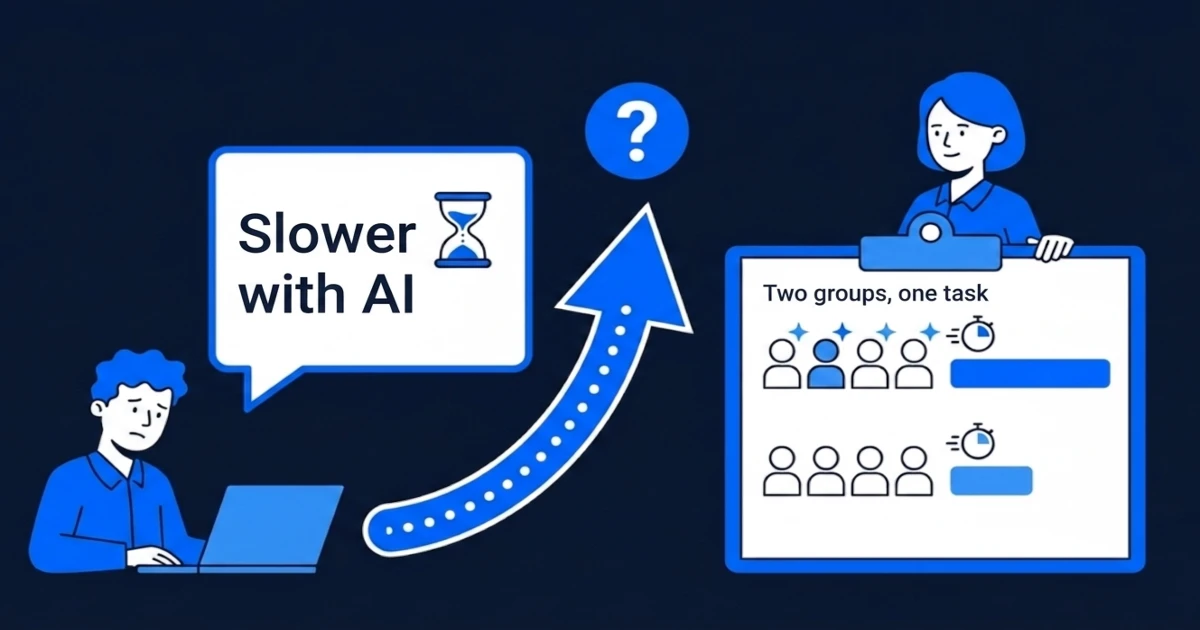
The caveat is the same one, and it matters more here. These studies measure different things: self-assessments, conversation telemetry, project post-mortems. They cannot be averaged. But one thing is worth noticing: in a year, not one instrument recorded return rising in step with adoption. The adoption curve travelled from 40% to 52%. The return curve over the same year went from 19% at Brookings to 14% at Workday, allowing for the fact that these are different rulers.
A reader who has got this far can already see both curves in other people’s reports. Seeing them in your own team is harder. There is no Gallup in there, but there is a list of use cases, hours spent checking, and saved time that goes somewhere.
Check where your team sits on these two curves: 9 real manager tasks with AI – free, no registration
No payment required • Get notified on launch
The first measurement on the return side
Until this summer the measurements on the return side agreed on one verdict – little, flat, not working – but without a ranking. Gallup’s July report carried the first table that breaks return down by use case. We went through it in a separate piece; here is the gist.
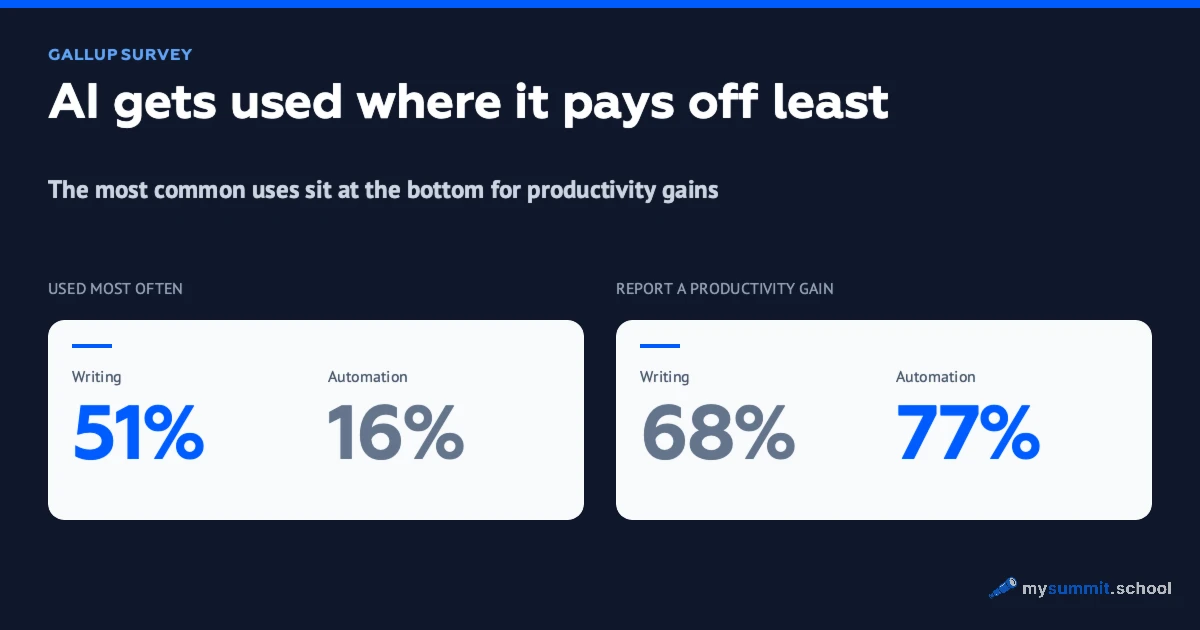
Among AI users, productivity gains are reported most often by those who use it for coding help and process automation, at 77% each. Presentations follow at 76%, analytics at 75%. The most widespread cases – writing text and search – close the table at 68% and 65%. There is also a spread by breadth: among people who use AI for one or two tasks, 45% report a gain; among those working with seven or more use cases, 90%.
Three caveats apply, and Gallup makes them deliberately. Productivity here is self-reported; there was no objective measurement in the survey. The link between breadth and return is a correlation: perhaps people whom AI suits simply find more uses for it. The sample is US only. All the same, a substantive shift has taken place. The question moved from whether AI delivers a return at all to which use cases deliver it. That is already a management question.
Why the curves diverge
Three mechanisms recur across sources independently of one another.
The first: only what is written down can be automated. In ATLAS, occupations with codified work plug AI in noticeably deeper – more than a quarter of conversations in structured cognitive work involve automation, against under 10% in unstructured work. Mass use cases like text and search belong precisely to work where the procedure is not written down, and their ceiling is low by design.
The second: the checking tax. Workday measured it at 37% of saved time. Dejan.AI and Anthropic described the same phenomenon back in December with the intern metaphor – work you check for longer than you would have taken to do it yourself. The further a use case sits from “write me a draft”, the higher the bar for checking the output, and the more often a team discovers that it has no skill for checking at all.
The third: saved time has no address. BCG found that 66% of rank-and-file employees receive no instruction about where to send the hours they free up, and more than half admit they do not put them into more important work. HBR showed what happens instead: task volume expands to fill the time saved. Savings without a destination turn into intensification.
The common denominator in all three is management. Microsoft’s Work Trend Index 2026 (in Russian) calculated that organisational factors determine 67% of the AI effect, twice the contribution of individual employee skills. The choice of use cases, the checking standard, the fate of the saved hours: all of these are decisions a manager makes, not a model.
The task mix moves slower than the habit
Adoption is rising, but mostly within the same use cases. In the latest Gallup wave the top rows are the ones from a year ago: text (51% of AI users), search (49%), general help (39%). The specialised cases – analytics, coding, automation, project management – sit in a band between 16% and 18%. The gap between frequent and occasional users concentrates exactly there: in coding and automation frequent users are nearly three times ahead, in text one and a half times. People who work with the tool every day move into specialised cases; people who drop in once a week stay with text.
Telemetry and interviews confirm the picture. Microsoft surveyed 885 product managers and checked the answers against M365 telemetry (spring 2025): document drafts 73%, summaries 52%, data analysis 22%, prototyping and code 12%. What gets delegated is work with low accountability that sits outside professional identity. Specifications and decisions stay with the human. Google’s ATLAS broke down 14.65 million conversations: work is only 14% of all Gemini traffic, and full task automation appears in under 10% of conversations even within work traffic. At Dejan.AI and Anthropic (in Russian), which ran 1,250 in-depth interviews in December 2025, the main use case across every group is starting from zero: a first draft that the person finishes themselves. Creatives draw the line plainly – 90% hand AI the administrative work and never the core of the craft.
The only thing that moved during the year is the mode of delegation. According to the Anthropic Economic Index figures cited by the AI Index, the share of automation in conversations rose from 41% in early 2025 to 49% in August, the first time it stood above the share of collaboration, and by November collaboration was back at 52%. That is oscillation: people try handing tasks over whole and return to working in pairs. The task mix has barely shifted in a year. That is the third curve, and it is flatter still than the return curve.
Trust does not keep pace with use
The second thing that did not grow over the year is trust in the output. Workday counted 37% of AI-saved time going on fixing AI mistakes – for an active user, a week and a half a year. In the Dejan.AI and Anthropic interviews, hallucinations are named the number one barrier in every respondent group, and for scientists checking an answer sometimes takes longer than the work itself would have. At Microsoft, 47% of product managers name output quality as the main barrier, and 56% say the effort has not fallen even though time is saved. BCG adds the other side: 60% of employees have raised their bar for acceptable work, and half now spend more time checking output than before.
The objective background is not improving either. Documented AI incidents reached 362 in 2025, against 233 a year earlier – up 55%, by the AI Index count.
Yet belief in the technology is distributed oddly. Positive effects on work are expected by 73% of experts and 23% of the public. Trust in the state as an AI regulator runs from 81% in Singapore to 31% in the US, the lowest figure in the Ipsos survey. People are using a tool they do not fully trust at scale, which is a normal picture for an early technology. The side effect is easy for a manager to read: trust here is earned by checking, and checking costs time. Until the team learns to check, it either overpays for control or lets errors through.
What business got
At company level the year produced something that individual statistics hide. Organisations started moving.
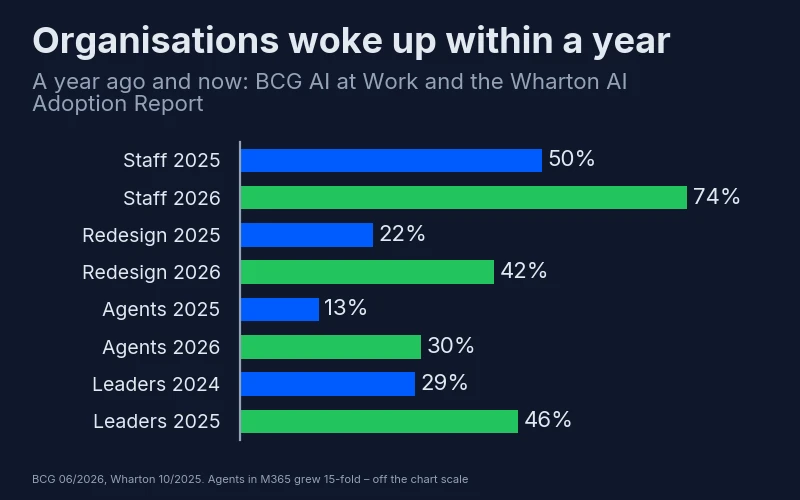
BCG’s fourth annual wave records three shifts at once: regular users among rank-and-file employees at 74% against roughly 50% a year earlier, companies redesigning whole processes at 42% against 22%, organisations running agents inside their processes at 30% against 13%. Wharton counted 46% of executives using AI daily against 29% a year earlier. Microsoft’s telemetry supplies the sharpest series of all: the number of active agents in Microsoft 365 grew fifteenfold in a year.
The return, meanwhile, is spread very unevenly. Wharton reports positive ROI at three quarters of enterprise companies, while MIT NANDA (in Russian) reports zero return at 95% of organisations against $30–40 billion of investment. The contradiction dissolves once you look at the samples: Wharton surveys the largest companies, which already have AI chiefs and a habit of measuring ROI, while MIT measures the whole market. For those inside the five percent the effects are concrete: lead qualification 40% faster, customer retention 10% higher, cuts only in support and administrative processing, at 5–20% of positions. The AI Index adds sector productivity estimates – up 14–15% in customer support, up 26% in software development – and the dark side with them: employment among US developers aged 22 to 25 has fallen almost 20% since 2022. Consumer surplus from AI rose from $112 billion to $172 billion over the year.
The picture is legible. Money and effect concentrate with the organisations that redesign processes; buying licences on its own delivers neither. At team level this is the same observation Gallup made, with a different denominator.
Where adoption happens
The most unexpected cut of the year is by country.
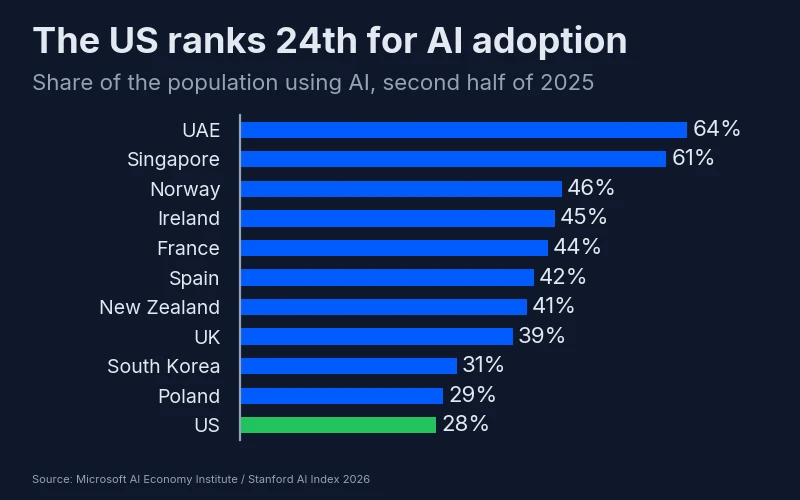
According to Microsoft AI Economy Institute data cited by the AI Index, the leaders are the UAE, where 64% of the population use AI, and Singapore at 61%. The US sits at 28.3% and 24th place, between Poland and the Czech Republic. South Korea grew fastest over six months, up 4.8 percentage points.
ATLAS telemetry adds two contrasting facts. First, India and Russia, both technology powers on paper, land in the bottom quintile for use per head. Second, the work share of conversations is highest in developing countries: in Nigeria 91% of use among users is for work, in the UAE 83%, in India 80%, while the US and Europe sit in the bottom quintiles. Where AI arrived recently, it is used above all for work. Where it has been around a while, above all for life.
For a manager outside the US, this is where the record goes blind. Gallup and SWAA poll Americans only, the AI Index country table does not cover every market, and ATLAS gives a quintile rather than a number. Nothing at Gallup’s level of regularity appeared for other markets during the year, and that is a finding in itself: every one of these figures reaches us adjusted for somebody else’s market.
What to do with it
Whether to adopt AI is no longer a live question. The statistics closed it. The open question is different: where in your team is the return, and where is motion for its own sake. Three moves follow from it.
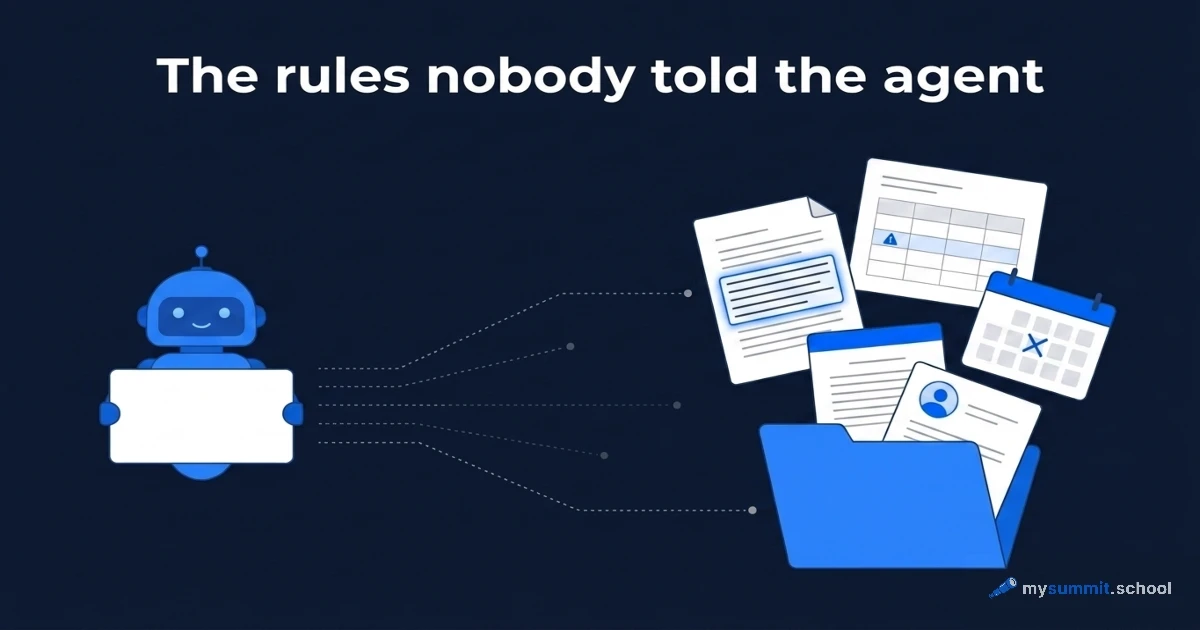
First, audit the use cases. Write down what the team actually uses AI for and sort it against Gallup’s return table. The prompt below does that for you: the table is already in it, along with an example list from a project office. Run it as it stands, then swap in your own items.
The models were picked from our benchmark. GPT-5.6 Sol leads the overall standings. Kimi K3 fits this task by profile: its strength is analysis and decisions, it reframes the problem and returns structured tables.
I ran the prompt on both models three times each. The return classes came out as expected: the status summary, the metrics review and the slides went to high return, the emails and the meeting summaries to medium. The knowledge-base search was more interesting: GPT-5.6 Sol put it in basic in all three runs, Kimi K3 in medium, but every time with the caveat that the use case sits on the boundary between knowledge management and search, and it showed both readings. After that came two disagreements. The first: the cost of checking did not match the level of return. Knowledge-base search, bottom of the return table, drew a high cost of checking in almost every run of both models. The answer sounds confident, and the error – an out-of-date version of a policy, two documents blended together – is visible only in the source, so checking costs as much as searching again.
The second disagreement was over the redesign candidates. Kimi K3 more often chose the status summary, arguing the risk of a blocker quietly lost in compression; GPT-5.6 Sol chose the quarterly report slides. That is a normal result. Where to grow depends on where the team hurts, and Gallup’s table has no single answer to that.
What to look at in the response: the justification for the cost of checking, above all, because it eats the saving. A pattern held across the runs: both models assigned the highest cost of checking to precisely the three use cases at the top of the return table – the summary, the metrics and the slides. Kimi K3 put the conclusion plainly: Gallup’s percentages are self-reported gains before the cost of checking, so the net gain is decided by process design. When you plug in your own use cases, read those justifications, not just the scores.
The second move is to put a price on checking. Keep a count of the hours the team spends reading and correcting AI output, then compare it with the hours saved. If rework grows faster than the savings, you are moving through use cases faster than your quality bar allows. This is that same 37% tax from Workday, counted on your own data.
Third, give the saved time an address. Before the team frees the hours, decide what they are for. Per BCG, without that decision the time dissolves for two thirds of employees. The prompt below is a template for the conversation with yourself: it carries the typical numbers, 8 hours a week saved by a team of six, and two quarterly goals. Substitute your own.
GPT-5.6 Sol named the same weak link in every run: splitting the hours evenly between the two goals. Eight hours a week is a fifth of a full-time post, and dividing it drops each track below critical mass. Kimi K3 assembled a different set of options each time, but wherever a 4+4 split appeared among them, it rejected that one on the same logic, and added a line worth keeping: time spread a little across everything dissolves first. One useful detail in both models’ answers: they insisted the saved hours be booked as protected calendar blocks with an owner. If there is no block, the time has already dissolved.
What the next year of measurement will show
A year of watching these reports leaves a simple picture. The adoption curve moves on its own: the licences are bought, the habit is formed, and two or three points a quarter require no decisions from companies at all. The return curve does not move by itself. It shifted exactly once, when Gallup first measured which use cases pay off, and it turned out that the most popular ones pay off worst.
The open question for next year is whether return stays a flat line once it is measured as regularly as adoption is. The answer depends on how many teams stop counting the percentage of adoption and start counting use cases, hours spent checking, and the address of the saved time. Your own percentage in that statistic is yours to choose.
Adoption has already happened. The next step is return
The Project Management specialisation: status, risks, reporting, automation – use cases from the top rows of the return table, worked through on your own project with feedback.
Measurements in this article: Gallup Panel, waves Q2 2023 – Q2 2026, samples of 22,000–24,000 working US adults per wave, margin of error ±0.9–1.0 points; Stanford SWAA, more than 200,000 observations, latest wave October 2025; Stanford AI Index 2026 (2025 data), including the Anthropic Economic Index, Microsoft AI Economy Institute and the Ipsos survey; BCG “AI at Work”, 11,749 respondents across 14 markets, June 2026; Wharton-GBK, October 2025; Brookings, 1,163 respondents, June 2025; MIT NANDA, 300+ deployments, 2025; Workday, 3,200 respondents; Epoch AI / Ipsos, March 2026; Google ATLAS, 14.65 million conversations, July 2026; HBR, an eight-month observation of around 200 employees, February 2026; Microsoft Research, a survey of 885 product managers with M365 telemetry, spring 2025; Dejan.AI / Anthropic Interviewer, 1,250 interviews, December 2025; Microsoft Work Trend Index, 20,000 respondents in 10 countries, May 2026. The methodologies differ, so levels across studies are not compared directly.
Часто задаваемые вопросы
How much did AI use at work grow over the year?
Why doesn't adoption turn into productivity growth?
Which AI use cases deliver the most?
How can a manager measure the return from AI in their own team?

Stanislav Belyaev
Engineering Leader at Microsoft18 years leading engineering teams. Founder of mysummit.school. 700+ graduates at Yandex Practicum and Stratoplan.