The Hidden AI Tax: Why 40% of Time Savings Disappear
87% of employees use AI at work. 77% say they’ve become more productive. Sounds like a digital transformation success story. But ask the uncomfortable question: if AI boosts productivity so effectively, why do only 14% actually see net gains? Where do the other 86% go?
Workday conducted a global study with 3,200 respondents – and found that behind the impressive numbers lies an inconvenient reality. Nearly 40% of time saved with AI is spent fixing its mistakes. This isn’t a bug in specific tools, nor a problem of “incorrect usage.” It’s a systemic failure in how organisations deploy artificial intelligence.
At mysummit.school, we’ve previously covered Dejan.AI (AI as a junior intern), Gallup (usage doubling in a year), and MIT (the gap between leaders and laggards). Workday adds a new angle: the measurable cost of low-quality AI output. And that cost turns out to be higher than many are willing to admit.
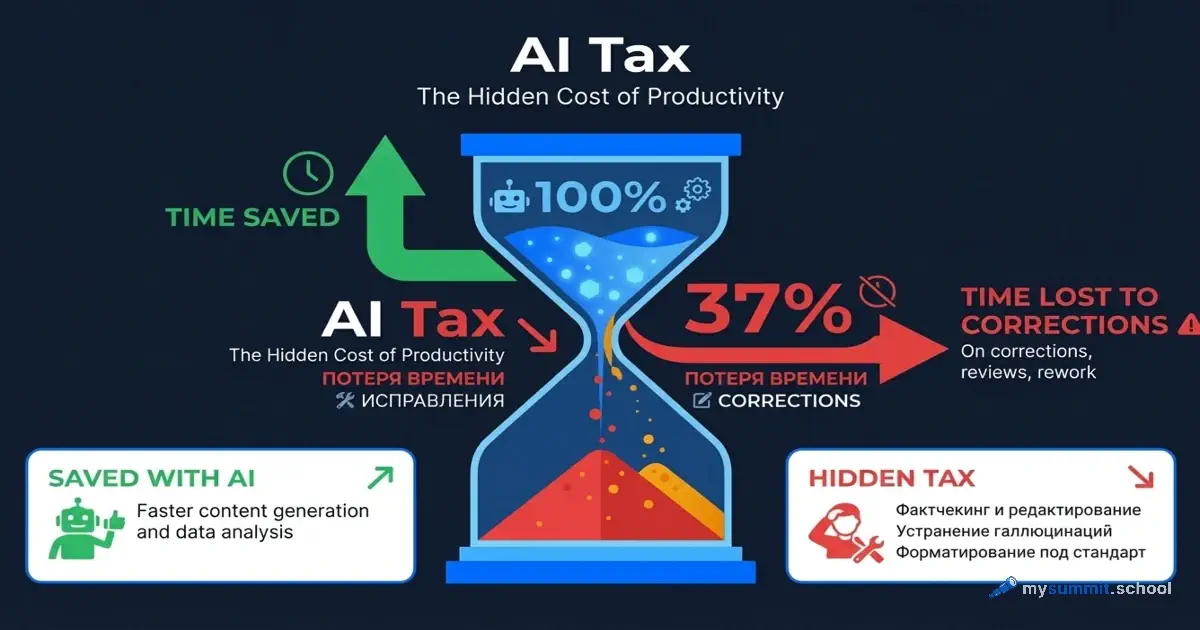
The Main Finding: A 37% “AI Tax”
Workday introduced the concept of AI Tax – a hidden productivity tax that companies pay for subpar AI output. The metaphor is apt: just like regular taxes, this “tax” is invisible in day-to-day work but hits the bottom line hard.
How the Tax Is Calculated
The formula is simple, yet rarely applied in practice:
Gross Efficiency – how much time employees save thanks to AI. This is the number that gets paraded in presentations: “We’re saving 5 hours a week!”
Operational Drag – how much time goes into reviewing, correcting, and rewriting AI-generated content. This number usually goes unmeasured. It shouldn’t.
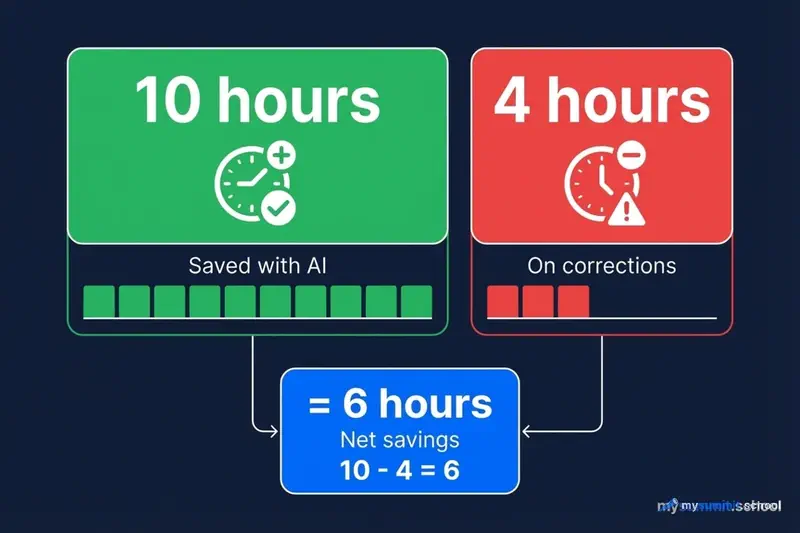
Net Value = Gross Efficiency − Operational Drag
According to the study, the picture looks like this: out of every 10 hours saved, nearly 4 hours go to fixing the results. That leaves 6 hours of real net savings. Not 10, as AI tool vendors claim – 6.
For active AI users, this translates to 1.5 weeks per year lost to fighting hallucinations, inaccuracies, and inappropriate tone in AI-generated text. One and a half weeks – more than the average vacation in the US.
Four Types of AI Users
Workday created a Net Productivity Matrix that segments employees along two axes: how much time they save with AI (X-axis) and how much net benefit they retain after deducting correction time (Y-axis).
The result is four types. And the distribution proved surprising.
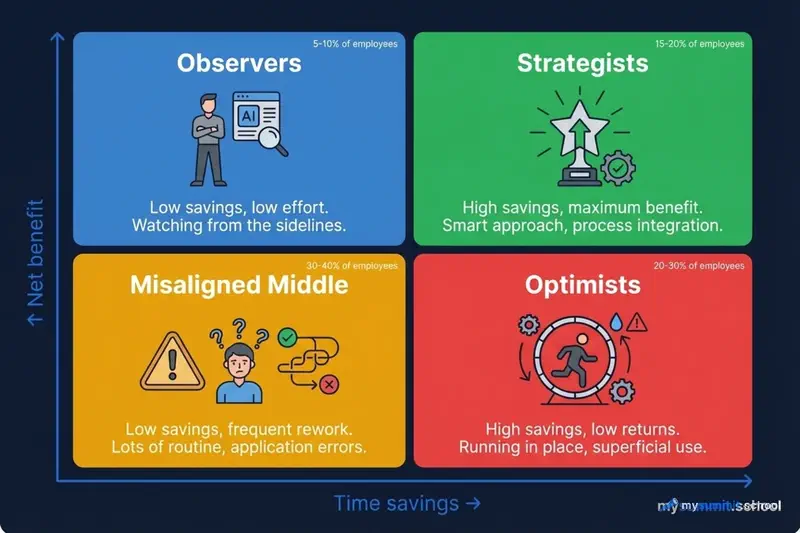
1. The Observers
These employees stand on the sidelines. They don’t spend time fixing AI, but they don’t benefit from it either. Low savings, low costs – and zero results.
Often found in HR and operations functions, they tend to work in organisations with low AI maturity. 33% of them note that the company has only 1–2 AI use cases in production.
Surprisingly, this group represents the easiest improvement potential – low barrier to entry, no negative experience to overcome.
2. The Augmented Strategists
These employees are rare. They use AI to improve outcomes, not just speed up work. High savings, high net benefit.
What sets them apart? 93% use AI as a “radar” for spotting patterns, not as a “crutch” for doing work in their place. This is a fundamentally different approach: AI helps them see more, not do less.
The Strategist profile: 71% are experienced professionals aged 35–44, concentrated in IT and marketing. 57% report that their company invests in team collaboration. And critically: they receive twice as much training as other groups.
3. The Misaligned Middle
These employees try to use AI, but the effort spent on rework exceeds the benefit. Low savings, high correction costs – a net loss.
89% of them report that fewer than half of roles in their company have been updated for AI. This raises a question: is the problem with the people, or the system? The data points to the latter.
17% worry that AI dependence is weakening their cognitive skills. And only 72% plan to stay at their company next year – the lowest figure across all groups. “The Misaligned Middle” isn’t a metaphor – it’s a diagnosis.
4. The Low-Return Optimists
The most enthusiastic AI users – and the most overloaded. High savings on paper, low net benefit in practice.
46% are employees aged 25–34, concentrated in HR. 56% use AI to take on more tasks, rather than more valuable tasks. They work more, not better.
And here’s the central paradox: 77% scrutinise AI content more rigorously than human work. This creates a hidden verification layer that consumes all the saved benefit. Yet only 37% receive additional training – the lowest of any group. 62% use AI daily.
The conclusion is counterintuitive: the most active users bear the highest correction burden. Enthusiasm without systemic support becomes burnout.
Who Pays the Most
Age: Young Employees Bear a Disproportionate Load
Employees aged 25–34 make up 46% of those who spend the most time fixing AI output.
Surprisingly, the stereotype that younger workers adapt faster to technology turns out to be a trap. Yes, they use AI more frequently and confidently. But does that mean they use it more effectively? The data says otherwise.
AI accelerates content creation, but accountability for quality doesn’t go away. It stays with the employee. Younger professionals take on more tasks with AI – and more tasks verifying AI.
Function: HR Suffers the Most
HR professionals account for 38% of employees with the highest AI rework levels. Why HR specifically?
The reason lies in the nature of the work. HR deals with people, communications, and compliance. Here, a “good enough” result is unacceptable – you need precision, the right tone, and fairness. A candidate letter with an awkward phrasing. A policy with a legal inaccuracy. A review with a biased assessment. The cost of error is too high.
So HR teams review AI content with exceptional thoroughness. And pay for it with their time.
IT professionals, by contrast, more often become Strategists (32% of them). They apply AI to pattern recognition, system optimisation, and exploratory analysis – tasks where an imperfect result is acceptable and easily refined. The difference isn’t in the people – it’s in the type of work.
Region: Differences in Reinvestment
The geographic data reveals a curious pattern.
North America: 83% of employees report increased productivity from AI – the highest figure. But only 64% of organisations reinvest the savings in people development – the lowest.
EMEA: 84% reinvest in people.
APAC: 89% reinvest in people.
The correlation is clear: where companies invest in skills and team resilience, employees more often convert time savings into sustainable improvements. Where organisations chase gross efficiency – they get rework.
The Gap Between Intentions and Actions
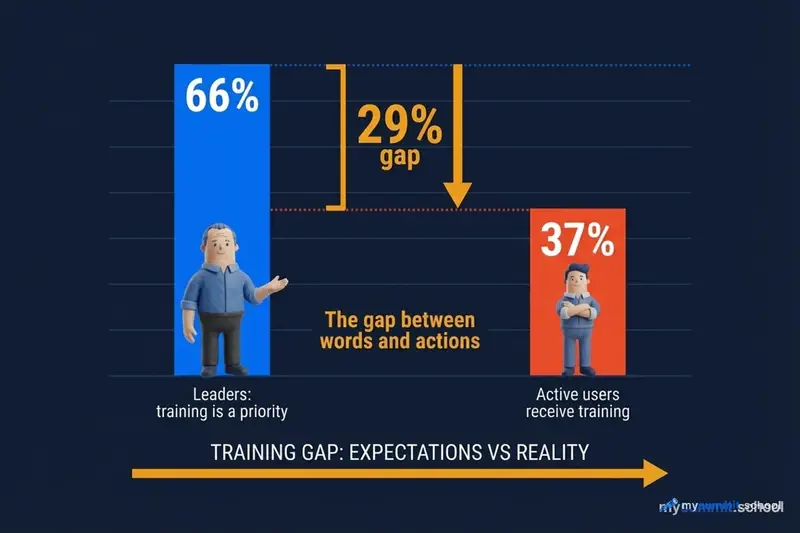
Training: A 30-Point Gap
66% of leaders call AI skills training the top investment priority.
37% of active AI users actually receive access to additional training.
A gap of 29 percentage points between words and actions. It raises a question: is training really a priority? Or is it simply the right answer to give on a survey?
Employees are responsible for the quality of AI output, but don’t receive the tools and knowledge to ensure it. The accountability was delegated – the resources were not.
Roles: AI on Old Rails
9 out of 10 organisations report that fewer than half of roles have been updated for AI.
Here lies a systemic problem. AI is being layered onto roles designed before it existed. Employees use 2026 tools within 2015 job descriptions. It’s like handing a Tesla driver the operating manual for a horse and cart.
54% of employees with productivity issues report that their skill requirements haven’t been updated. In organisations struggling to achieve net productivity, fewer than 25% of roles are adapted for AI.
Perhaps it’s worth acknowledging the obvious: you can’t deploy a new technology into an old organisational structure and expect magical results.
Investment: Technology vs People
Where companies direct AI savings:
| Area | Share of investment |
|---|---|
| Technology and infrastructure | 39% |
| People development | 30% |
Technology receives 9 pp more than people.
Where Saved Time Goes (Survey of 1,700 Leaders)
| Priority | % of leaders |
|---|---|
| Focus on strategic tasks | 53% |
| Operational efficiency | 46% |
| Reducing employee workload | 45% |
| Improving customer experience | 33% |
| Increasing output without growing headcount | 32% |
| AI skills training | 29% |
| R&D | 20% |
AI training is second to last – below “increasing output without growing headcount.”
The Burnout Paradox
Daily AI users exhibit a peculiar combination:
High optimism:
- Over 90% are confident AI improves their chances of success in future roles
High workload:
- 77% review AI content with the same or greater rigour than human work
- This creates a hidden verification layer
The retention paradox:
- 95% plan to stay at their current job next year
- But only 56% would choose this same job again
Benefits and flexibility keep people in their seats. But the accumulated cost of rework erodes long-term engagement.
Burnout in the AI era is not resistance to change. It’s sustained exposure to low-quality output without adequate organisational support.
What a Manager Should Do
Workday proposes four areas for action.
1. Measure Net Value, Not Hours Saved
The metric “how much time we saved” obscures the real picture. You need to account for correction time.
Example metrics by function:
| Function | Instead of | Measure |
|---|---|---|
| HR | Time to fill a vacancy | Quality of hire |
| Finance | Transaction speed | Forecast accuracy |
| Operations | Output volume | First-pass yield |
2. Invest Where Friction Is Highest
Identify the functional, geographic, and demographic “hot spots” where Low-Return Optimists concentrate.
- Targeted prompt engineering training for the 25–34 age group
- Specialised training for HR teams working with sensitive content
- Redirect budgets from wellness programmes (symptoms) to training (causes)
3. Update Job Descriptions
AI cannot simply be added to existing roles without consequences.
Conduct a role audit in high-friction departments:
- Where AI should assist
- Where human judgement is critical
- How success is measured
4. Use Saved Time for Human Interaction
Organisations that achieve net gains from AI explicitly permit employees to use saved time for collaboration, learning, and strategic thinking – rather than simply increasing task volume.
57% of Strategist organisations already follow this practice.
Workday’s AI Readiness Checklist
- Measure net value – track outcomes and rework, not just hours
- Focus investments – direct skill development to roles and demographics with high friction
- Update role design – formally incorporate AI competencies into job descriptions
- Reinvest time in people – channel AI savings into skill development and collaboration time
Key Takeaways
37% is not a death sentence. It’s a manageable figure. Organisations that invest in training and update roles reduce this “tax.” The question isn’t whether to pay – it’s how to minimise it.
Active users ≠ effective users. Enthusiasm without support creates overloaded employees, not productive teams. Frequency of AI usage is a poor proxy for quality of outcomes.
Technology without people doesn’t work. The 39/30 split in favour of infrastructure is a strategic error. The data shows an inverse relationship: more investment in people = higher net productivity. Not the other way around.
Roles need redesigning. AI is being layered onto outdated job descriptions. This is a systemic problem, not an individual one. Blaming employees for low AI efficiency is like blaming the driver for traffic jams.
Measurement needs rethinking. “We saved 10 hours” is a meaningless metric without accounting for 4 hours of corrections. Gross efficiency is for presentations. Net value is for business.
The Workday study raises a deeper question. If 37% of AI savings are lost to corrections – perhaps we’re measuring the wrong things? Organisations chase adoption rates and hours saved while ignoring the quality of results.
Are we repeating the mistake of the “digital transformation” era, when companies deployed technology for technology’s sake, then wondered where the ROI went?
AI Tax is not just a metric. It’s a symptom. We’re automating processes without rethinking them. Layering new tools onto old structures. Expecting miracles without changing how people actually work.
And until that approach changes, the “tax” will only keep growing.
Sources
- Beyond Productivity: Measuring the Real Value of AI – full Workday report (January 2026)
- Workday Global Workforce Report – related study on AI gains distribution
Want to reduce the 'AI Tax' in your work?
Course programme: Foundation module on prompt engineering and critical thinking + specialisations in project management and analytics. Practical skills, not theory.